Without a market, a business doesn’t have much of a future. Actually understanding the potential size and shape of the market is a critical step in the early stages of developing a business, as it will help to inform a winning go-to-market strategy everything from your short and medium-term objectives, product development, right through to the way you pitch to investors.
Here’s a beautiful example of market research in action, at the genesis of a business. Facebook (now Meta) is almost ubiquitous in modern life. However, it wasn’t always like that. When Facebook was new, the entire social media sphere was effectively untested and unproven. Facebook (then TheFacebook) needed to prove a lot—not least that there was an actual audience for it. Here’s an actual slide from those early days:

It makes a pretty compelling argument, right? Without Facebook having such a successful proposition early in its life, it may have never had the opportunity to grow into what it is today, but investors bought into the promise of tapping into the college students market, and the rest is history.
How did Facebook arrive at those numbers, and how can you do the same for your startup? Being able to do this for your own startup idea comes down to three acronyms: TAM, SAM & SOM. By understanding these metrics, you can allocate resources effectively to drive smarter decisions in product development, pricing, and go-to-market strategies.
Introduction to Market Sizing
Market sizing is a crucial step in understanding the potential of a business idea. It involves estimating the total addressable market (TAM), serviceable addressable market (SAM), and serviceable obtainable market (SOM) to determine the potential revenue and growth opportunities. By conducting thorough market research and analyzing industry data, businesses can identify their target market, estimate their market share, and develop effective marketing and sales strategies. Understanding the market size and potential is essential for attracting investors, allocating resources effectively, and achieving business growth. This process not only helps in setting realistic business goals but also in crafting a compelling narrative for potential investors.
What is TAM, SAM & SOM
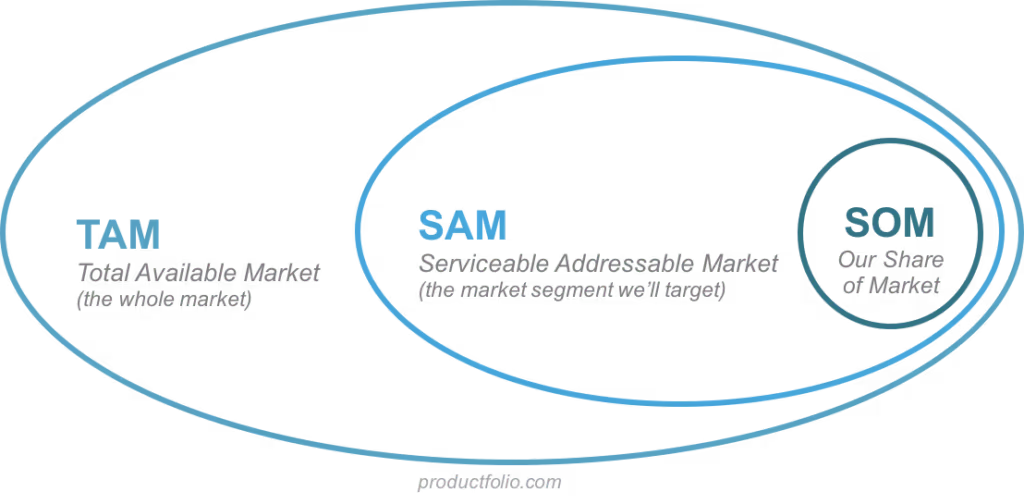
TAM = Total Addressable Market (Or Total Available Market)—This represents the revenue opportunity that a company has if it has a full 100% of the market share, and there is no competition. TAM represents the total revenue opportunity available for a product or service in a specific market.
SAM = Serviceable Addressable Market—This represents the “slice” of the TAM “pie” that can be served by a company’s products and services.
SOM = Serviceable Obtainable Market—This represents the actual amount of the market that is being served by the company’s products and services.
These three terms are related to one another, and are generally depicted as a series of three circles, with SOM being nested in SAM, and subsequently nested within TAM:
Of the three, TAM is the foundation, so we’ll start by calculating that first.
Total addressable market (TAM)
TAM is the “pie in the sky” number. It represents the absolute maximum possible revenue that a business could generate in the market, if every single potential customer is converted into a paying customer, and each of those customers is providing the full maximum revenue. TAM can be calculated by multiplying the number of potential customers by the average revenue per customer.
It’s a useful number as it helps to understand the potential scale of the business, and can help to establish a seed of the go-to-market strategy. However, it’s not a realistic goal. No matter how well you execute the business strategy, and no matter how beloved your product is, you’ll never reach the TAM number, because it assumes that you’re the only provider of the product or service and have zero competition.
Monopolies like that don’t exist, and even if you do have a revolutionary idea and create an entirely new product category, then you can expect competition to appear long before you’ve hit the TAM number.
How to calculate TAM
When calculating TAM, there are a few different approaches you can take. These include:
Top Down Approach
The top down approach involves analyzing industry reports, industry data, market reports, and research studies. IDC, Gartner, and others frequently produce reports on the size of markets and subsections, and by aligning that data with your own business objectives, you can get a sense of the potential market for it.
Of course, the data found in these reports might not be specifically what you need or might be out of date. A large company with greater resources will eventually engage with a firm to conduct new research and determine its TAM, but few startups would want to dedicate their limited resources to this. In most cases, startups will use the generalized data sets, understanding that they need to take the information with a pinch of salt.
Bottom Up Approach
Alternatively, you can make TAM calculations based on previous sales and pricing. Accurate market data is essential for refining these calculations and ensuring realistic estimates. Take the total number of potential customers in a market, and multiply that number by the annual contract value (ACV). The ACV is the amount of revenue that you would gain from each customer contract, on average.
This is a simple equation. Say you sell medical software, at an average of $1,000 for a year’s license. The only customers that are going to be interested in this software are hospitals, of which there are 1,352 hospitals in Australia. Your TAM, therefore, is $1.35 million.
Value Theory Approach
The third method of determining TAM is a little more subjective, but particularly useful for entrepreneurs in highly innovative sectors, or those that aren’t yet selling a product. The value theory approach is based on how much customers are willing to pay for your product or service in exchange for the value that they’re getting for it. This approach helps in understanding the market potential by evaluating how much customers are willing to pay for the added value.
The calculation is the same as the bottom up approach, above, but rather than calculate the average sale price, you’re looking at what a comparable product sells for, and what premium your superior product could attract.
To use the medical software example above, say that your software is the first in the space that sits in the cloud and allows hospital administrators to access the software from anywhere. In this instance, you would want to include the premium that administrators would pay for that convenience to the TAM, to represent the greater expected revenue you would get from each customer for your unique feature.
Service Available Market (SAM)
With the SAM, we start getting a little more realistic about things. SAM represents the “slice” of the TAM “pie” that can be served by your company's products and services. In other words, SAM is a calculation that understands that no product can service an entire market.
How to calculate SAM
Calculating SAM is a continuation of the bottom up approach that you used to calculate TAM. This is the point where you start to get more realistic about just how much of your product you can sell. Every startup entrepreneur fantasizes that their product will be relevant to everyone in their category, but that of course is not the case.
To continue our example above, perhaps your product has a set of features that make it more relevant to the public hospital sector than the private hospital sector. A percentage of the private hospitals in Australia might still purchase the solution (more if your sales team is good!), but the SAM calculation would therefore be based on the number of public hospitals in Australia. There are 695 of them, meaning that with an ACV of $1,000, the SAM for your software package is $695,000.
Service Obtainable Market (SOM)
Finally we come to SOM. This represents the actual amount of the market that is being served by your company’s products and services, and while it’s only relevant once you’re in the market, it becomes a critical component in assessing your startup and its potential going forward. Understanding your competitive position is essential for setting realistic revenue goals. For more information, see Serviceable Obtainable Market.
How to calculate SOM
You’ll want to start calculating SOM once your business is in the market and has customers. Awareness of market dynamics can greatly influence the accuracy of SOM calculations. The SOM is determined by calculating last year’s market share, multiplied by this year’s SAM value.
First you need to determine market share. Say there are only two businesses that sell software with this functionality, and your business sold $400,000 in software last year. Your market share is that number, divided by the SAM (around 0.58, or 58%). Your rival has the remaining 42%.
Now, say there were an additional 20 hospitals brought online in the year. The new SAM for the next year is $715,000. Your SOM is determined by multiplying the market share from last year with the SAM for this year—or roughly $414,700 in this example.
If you end up earning more for the year than that number, then you’re taking market share from your rival. If you earn less, then you’ll want to explore why your competitor is gaining traction.
Note:
While SOM measures market share, and therefore is 0 until your business is in the market, there are, of course, ways to estimate the market share that your product will target once in market. For illustrative purposes—for example, when pitching to VCs—creating hypothetical SOM scenarios in this way might be a useful exercise for a founder.
Identifying Potential Customers
Identifying potential customers is a critical step in market sizing. It involves understanding the demographics, needs, and preferences of the target audience. Businesses can use various market research tools and techniques, such as customer surveys and focus groups, to gather valuable data on potential customers. By analyzing this data, businesses can create detailed buyer personas, estimate the total addressable market, and develop targeted marketing and sales efforts. Understanding potential customers is essential for creating effective marketing strategies, allocating resources effectively, and achieving business growth. This targeted approach ensures that marketing and sales efforts are directed towards the most promising customer segments, maximizing the return on investment.
Understanding Your Target Market
Understanding the target market is essential for businesses to develop effective marketing and sales strategies. It involves analyzing industry data, market reports, and the competitive landscape to identify specific market segments relevant to the business. By understanding the target market, businesses can estimate their market share, identify opportunities and challenges, and develop targeted marketing and sales efforts. The target market analysis is crucial for calculating TAM, SAM, and SOM, and for allocating resources effectively. Businesses can use market research tools and techniques, such as market segmentation and customer profiling, to gather data on the target market. This deep understanding of the market landscape allows businesses to position themselves strategically and capitalize on market opportunities.
Why Do TAM, SAM and SOM matter to a startup?
For a startup, the TAM value is the one that tells a story, and can be integral to attracting investors. What you'll quickly find is that investors love a “Goldilocks” business, as far as the TAM goes. If the TAM is too high, then investors will tend to assume there's a lot of competition and the market is probably going to be too saturated. If the TAM is too small, then the business' ceiling is probably going to disqualify it. It's when the TAM is just right that they'll fall over themselves to get the cheque book out.
To continue our above scenario, our poor software entrepreneur might be providing a critical service to those hospitals and saving lives, but a prospective investor is going to want to see how that TAM of $1.3 million can be grown to a larger potential audience. Perhaps the entrepreneur could build a variation of the software for the financial services sector and lift the number of potential customers, or take their software into international markets to reach more hospitals.
Meanwhile, for saturated markets, the discrepancy between the TAM, SAM and SOM will be the sticking point with investors. The PC market might have a TAM of $250 billion, according to Canalys data, but that's a highly mature market with a lot of massive companies competing for market share. Once a PC manufacturer calculates their SAM and SOM, the gap will be so significant that the investor will only see an expensive cost to acquire new customers, and therefore a high risk business.
That's not to say that the niche healthcare software provider can't build a healthy business and eventually expand. It just means that a $50 million funding round in the early stages is unlikely unless the TAM can be increased.
Likewise, it is possible for a new player to break into a mature market with entrenched incumbents, but for them it would be important to be able to make a value theory argument and clearly identify a SAM within the TAM that is under-serviced, and where market share can be gathered quickly.
Five tips for crafting the perfect TAM slide
For most startups, the TAM slide’s going to be one of the more important ones that investors will want to see, and will contribute to the first impressions they have of the viability of the business idea. Like the Facebook example, above, you want this to be a good first impression. A well-crafted TAM slide can boost investor confidence by showcasing a deep understanding of the market.
There are a couple of worthwhile things to keep in mind while crafting this slide, to maximize the potential for it to set a positive first impression:
1) Bottom up is generally preferred to top down.
Investors like to see original research and analysis. The top down approach can come across as lazy—as though the founder simply grabbed some data off Google—and it doesn't necessarily paint a picture around how the startup sees itself placed in the market.
2) Don't over-inflate the numbers, even with the TAM.
If your product is being designed for Gen Z customers, don't include millennials in the numbers. If it's a product for the Australian market, don't use global numbers. In short, understand the difference between the core audience (who should be reflected in the TAM, as customers that you're actively pursuing) and accidental customers (people that buy your product or service despite being outside the core/target audience).
3) Be clear on the geography.
It's easier than ever for businesses to operate globally, but unless you're specifically aiming for a global operation, be sure that the TAM, and the data shared within it, is clear on geography.
4) Understand that there will be scrutiny on the price.
If you're not yet trading, the TAM will, by nature, require an assumption to be made about the average price that the product will sell for, so you can calculate the ACV. Be sure that the answer you arrive at is defensible and substantiated. You don't need to include the math on the slide itself, but be sure to have it ready for when (not if) it's asked for.
5) Have a vision for the future.
Highlight how, on the product roadmap, the TAM can increase over time. Facebook itself is a great example; the website was started as a tool for college students, but these days is well-recognised as a platform that boomers and Gen-X audiences enjoy.
Facebook's TAM now looks very different to it would have back then, and it's a good idea to include some idea on where the market might develop over time.
Creating a Comprehensive Business Plan
A comprehensive business plan is essential for businesses to achieve their objectives. It involves outlining the business strategy, marketing and sales strategies, financial projections, and operational plans. By conducting market research and analyzing industry data, businesses can create a comprehensive business plan that outlines their target market, estimates their market share, and develops effective marketing and sales strategies. The business plan should include a detailed analysis of the competitive landscape, market conditions, and market opportunities. Businesses can use market research tools and techniques, such as SWOT analysis and market sizing, to gather data and create a comprehensive business plan. This well-rounded approach ensures that all aspects of the business are considered, providing a clear roadmap for success and boosting investor confidence.
Resources for determining market size
While you can hire companies to do market research on your behalf, entrepreneurs should try and do research themselves, both to better understand the market and its dynamics, and where their own business will fit in. Financial reports from publicly traded companies are valuable resources for calculating Total Addressable Market (TAM), Serviceable Available Market (SAM), and Serviceable Obtainable Market (SOM), providing reliable market data and financial insights.
1) Analysis and research online.
Just about every sector and product category has analysts that keep a close eye on it. This information is useful to understand in a broad sense the performance of a market, as well as observe historical data and track overall market trends.
2) Financial reports.
Knowing the performance of your publicly-listed competitors is useful, especially since you can run some basic SAM and SOM analysis on them to get a sense of what kind of goals you can set for your own business.
3) Talk to people in the industry.
Sometimes, it doesn't matter how much data you look at, you're still not going to get a full understanding of the market. Talking to veterans or consultants in the space can help you to understand the segments and cross-sections within the overall category, as well as those audiences that are considered particularly “friendly”.
4) Market research tools.
There are any number of online tools available that can help you compare companies, understand the keywords and searches that customers are using to find those companies, and where their online presence comes from.
A Final Note
One final thing to note: While a TAM, SAM, and eventually SOM is a useful, if not critical, part of the business development process for startups, in some sectors—such as technology—where innovation tends to result in entirely new product categories, a TAM might seem initially low.
If you create TAMs for all of these companies, when they were new, the numbers would have been very low indeed: Google, LinkedIn, Facebook, Uber, Amazon, Ebay. As these companies grew, so too did their target audience, and therefore the scope of the TAM.
In short, it might be a critical document for articulating the vision and initial potential of the company, but a TAM isn’t going to prove that your business will be successful, nor will it represent a permanent upper limit to the abolition that you can have for it. Understanding market opportunity is crucial for making informed decisions in product development and sales efforts.
For all press enquiries: press@antler.co


.png)